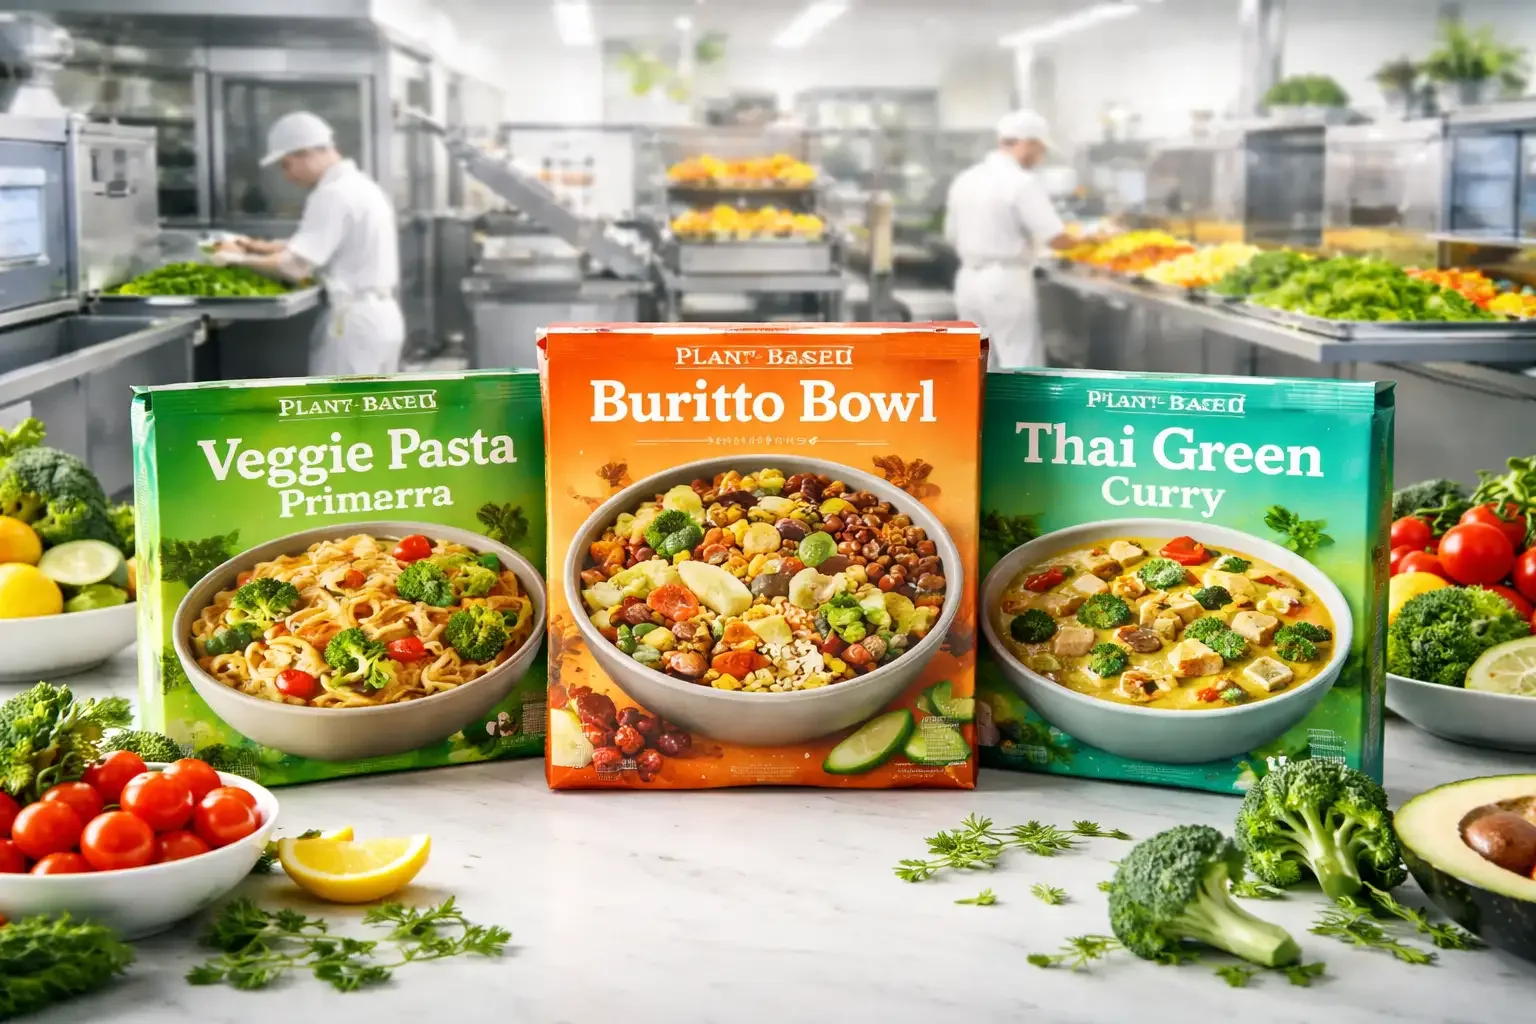

Q1 2026 Financial Review and Cash Flow Analysis — GreenFork Foods
GREENFORK FOODS Internal Financial Memorandum
TO: Financial Analyst FROM: David Ortega, Chief Financial Officer DATE: March 28, 2026 RE: Q1 2026 Financial Review and Cash Flow Analysis
CONFIDENTIAL — FOR INTERNAL USE ONLY
Executive Summary
This memo provides a comprehensive review of GreenFork Foods' Q1 2026 financial performance and working capital position. While the company achieved profitability during the quarter, our liquidity position has deteriorated significantly due to retailer payment term extensions and rising organic ingredient costs. Immediate attention is required to address cash flow constraints that will impact our ability to meet operational obligations and fund seasonal inventory requirements.
Working Capital Summary
Balance Sheet Components (as of March 31, 2026)
| Metric | Amount |
|---|---|
| Accounts Receivable | $687,000 |
| Inventory | $412,000 |
| Accounts Payable | $198,000 |
Q1 2026 Operating Performance
| Metric | Amount |
|---|---|
| Quarterly Revenue | $2,050,000 |
| Quarterly COGS | $1,660,000 |
Working Capital Efficiency Metrics
Our working capital cycle has expanded substantially compared to our December 2024 baseline:
| Metric | March 2026 | December 2024 |
|---|---|---|
| Days Sales Outstanding (DSO) | 61 days | — |
| Days Inventory Outstanding (DIO) | 45 days | — |
| Days Payables Outstanding (DPO) | 22 days | — |
| Cash Conversion Cycle | 84 days | 52 days |
The 32-day extension in our cash conversion cycle from 52 days to 84 days represents a fundamental shift in our working capital requirements. Each day of cash conversion cycle extension ties up approximately $18,400 in operating cash based on our current daily COGS run rate.
Retailer Payment Terms Analysis
Three of our largest retail partners have unilaterally extended payment terms over the past four months, creating significant strain on our receivables position:
Payment Term Changes and Receivables Impact
| Retailer | Term Change | Receivables Impact |
|---|---|---|
| FreshMart Midwest | Net 30 to Net 60 effective January 2026 | $142,000 |
| Natural Grocers Ohio | Net 30 to Net 45 effective February 2026 | $118,000 |
| Whole Health Markets | Net 30 to Net 60 effective December 2025 | $80,000 |
| Total Receivables Gap | $340,000 |
These three retailers collectively represent approximately 58% of our Q1 revenue. The timing of these extensions was not coordinated with GreenFork, and we received minimal advance notice in each case. FreshMart Midwest cited "alignment with regional supplier standards" in their January notification, while Natural Grocers Ohio referenced "cash management optimization" in February. Whole Health Markets implemented their change in December 2025 without formal written notice—we discovered the extension when their January payment arrived 30 days later than expected.
The $340,000 receivables gap represents cash that would have been collected under our original Net 30 terms but remains outstanding due to the extended payment windows. This amount is effectively an involuntary loan to our retail partners, funded by our working capital.
Cost Pressure Analysis
Organic Ingredient Cost Escalation (January–March 2026)
Our two primary ingredient categories have experienced sharp cost increases during Q1 2026:
| Ingredient Category | Cost Increase (Jan–Mar 2026) |
|---|---|
| Organic Vegetables | 22% |
| Organic Proteins | 14% |
| Blended Ingredient Cost | 18% |
The 22% increase in organic vegetable costs has been driven primarily by weather-related supply disruptions in California and the Pacific Northwest, combined with higher certification and labor costs reported by our suppliers. Organic protein costs rose 14% due to increased demand for pea and soy protein isolates across the plant-based food sector, compounded by tighter domestic supply.
Our blended ingredient cost increase of 18% reflects the weighted average across all input categories, including vegetables (representing approximately 52% of our ingredient spend), proteins (31%), and other ingredients such as organic oils, seasonings, and stabilizers (17%).
Margin Compression and Profitability Impact
| Metric | December 2024 | March 2026 | Change |
|---|---|---|---|
| Gross Margin | 23% | 19% | -4 percentage points |
| Net Income (Q1 2026) | — | $82,000 | — |
Our gross margin declined from 23% in December 2024 to 19% in March 2026, a 4-percentage-point compression driven almost entirely by the 18% ingredient cost increase. We have been unable to pass through the full cost increase to our retail partners due to existing supply agreements and competitive pricing pressure in the plant-based ready meal category.
Despite the margin compression, GreenFork achieved $82,000 in net income during Q1 2026, demonstrating that the company remains operationally profitable. However, profitability has not translated into liquidity improvement.
Cash Position Deterioration
| Metric | December 2024 | March 2026 | Change |
|---|---|---|---|
| Cash Balance | $215,000 | $67,000 | -$148,000 |
Our cash balance declined $148,000 from $215,000 in December 2024 to $67,000 as of March 31, 2026. This $148,000 cash outflow occurred during a quarter in which we generated $82,000 in net income, illustrating the disconnect between profitability and cash generation. The primary drivers of this cash consumption were the $340,000 receivables gap created by retailer payment term extensions and the working capital required to support higher inventory levels at elevated ingredient costs.
Supplier and Production Constraints
Key Supplier Payment Terms and Spend
Our two largest ingredient suppliers operate on significantly shorter payment terms than we receive from our retail customers:
| Supplier | Payment Terms | Monthly Spend | Relationship |
|---|---|---|---|
| Heartland Organic Farms | Net 15 | $78,000 | Since founding (2019) |
| Midwest Plant Protein Co | Net 20 | $52,000 | — |
Heartland Organic Farms has been our primary organic vegetable supplier Since founding (2019), providing certified organic produce from a family-owned farm collective in central Ohio. This relationship is strategically critical: Limited — only 2 certified organic vegetable suppliers within 150 miles of our production facility can meet our volume, quality, and certification requirements. Switching suppliers would require significant lead time for qualification, testing, and supply chain integration, and would likely result in higher costs or quality variability.
Our Net 15 payment terms with Heartland Organic Farms and Net 20 terms with Midwest Plant Protein Co create a structural timing mismatch: we must pay our suppliers within 15–20 days of receiving ingredients, while our retail customers now pay us in 45–60 days. This 25–45 day gap must be funded from working capital or external financing.
Production and Inventory Constraints
| Constraint | Value |
|---|---|
| Production Lead Time (Frozen Entrees) | 3 weeks |
| Inventory Shelf Life (Frozen Products) | 9 months |
| Seasonal Inventory Requirement | $180,000 |
| Seasonal Inventory Timing | 8 weeks (early May 2026) |
Our frozen entree production requires 3 weeks from raw ingredient receipt to finished goods ready for shipment. This lead time includes ingredient prep, cooking, blast freezing, packaging, and quality testing. The 3 weeks lead time means we must maintain sufficient raw ingredient inventory to support continuous production, as any supply interruption would create a three-week gap in finished goods availability.
Frozen products have a 9 months shelf life from production date, providing flexibility for inventory management but also requiring careful production planning to minimize waste from expiration.
Our seasonal inventory requirement of $180,000 must be funded 8 weeks (early May 2026) to support the June–November peak demand period. This seasonal build is driven by back-to-school meal planning (August–September) and holiday purchasing (October–November), which together represent approximately 62% of our annual revenue. The $180,000 represents incremental raw ingredient purchases and finished goods production beyond our normal monthly run rate, and must be in place by early May to ensure adequate supply for retailer orders beginning in June.
Financing Options and Receivables Quality
Available Credit Facility
| Facility Term | Amount |
|---|---|
| Available Line of Credit | $250,000 |
| Current Utilization | $0 |
| Interest Rate | 8.5% |
GreenFork maintains a $250,000 revolving credit facility with Midwest Regional Bank, currently with $0 utilization. The facility carries an 8.5% annual interest rate and requires a minimum current ratio covenant of 1.2x. As of March 31, 2026, our current ratio stands at 1.38, providing covenant headroom but leaving limited margin for further working capital deterioration.
The credit facility is secured by accounts receivable and inventory, with an advance rate of 80% on eligible receivables and 50% on eligible inventory. Based on our March 31 balance sheet, we could draw approximately $550,000 against receivables and $206,000 against inventory, though the facility limit of $250,000 constrains our actual borrowing capacity.
Receivables Aging Analysis (as of March 31, 2026)
| Aging Bucket | Amount |
|---|---|
| Current (0–30 days) | $412,000 |
| 31–60 days | $198,000 |
| 61–90 days | $77,000 |
| Total Receivables | $687,000 |
Our receivables aging shows $412,000 in the current bucket (0–30 days), representing 60% of total receivables. The $198,000 in the 31–60 day bucket (29% of total) reflects the extended payment terms from FreshMart Midwest and Natural Grocers Ohio, while the $77,000 in the 61–90 day bucket (11% of total) corresponds primarily to Whole Health Markets' Net 60 terms.
All aged receivables are with established retail partners operating under extended payment terms, not past-due accounts. We have experienced no material bad debt losses in our operating history, and all three retailers extending payment terms remain financially stable regional chains. However, the aging profile illustrates how the term extensions have shifted our receivables mix toward longer collection periods, directly contributing to the 61 days DSO and 84 days cash conversion cycle.
Request for Analysis
I need you to prepare a comprehensive cash flow management plan that addresses our immediate liquidity constraints and positions us to fund the seasonal inventory requirement. Your analysis should focus on the next 45 days, during which our cash position will become critical.
Please provide your recommendations and supporting analysis by April 4, 2026.
David Ortega Chief Financial Officer GreenFork Foods
CONFIDENTIAL — This document contains proprietary financial information of GreenFork Foods and is intended solely for internal management use. Unauthorized distribution or disclosure is prohibited.