
| Segment | Age Range | Subscriber Count | % of Base | QoQ Growth Rate Q4 2024 | Lifetime Value USD | Monthly Churn Rate % | Avg Subscription Length (Months) | TikTok Engagement Rate % | Instagram Engagement Rate % | Customer Acquisition Cost USD | Repurchase Rate % | Avg Order Value USD | Primary Product Interest |
| --- | --- | --- | --- | --- | --- | --- | --- | --- | --- | --- | --- | --- | --- |
| Gen Z | 18-27 | 4680 | 0.26 | 0.32 | 198 | 0.112 | 9 | 0.084 | 0.051 | 38 | 0.42 | 22 | acne treatment, hydration serums, affordable multi-step routines |
| Millennial | 28-43 | 8280 | 0.46 | 0.14 | 340 | 0.068 | 15.5 | 0.042 | 0.067 | 52 | 0.61 | 22 | preventive anti-aging, brightening treatments, clean ingredient formulations |
| Gen X | 44-59 | 5040 | 0.28 | 0.23 | 286 | 0.047 | 13 | 0.021 | 0.038 | 61 | 0.68 | 22 | corrective anti-aging, retinol-based products, premium ingredient efficacy |
| Total Active Subscribers | | 18000 | | | | | | | | | | | |
Note: Data extracted January 15, 2025 from Brightwell Skincare customer analytics platform
Note: Subscriber counts and percentages reflect active subscriptions as of January 2025
Note: QoQ growth rates calculated for Q4 2024 (October-December 2024)
Note: Engagement rates measured across Q4 2024 campaign performance on TikTok and Instagram
Note: Customer Acquisition Cost (CAC) represents blended cost per new subscriber acquired in Q4 2024
Note: Lifetime Value (LTV) calculated using historical cohort data and current retention curves
Note: Monthly churn rate averaged across Q4 2024; subscription length reflects median tenure for active subscribers
Note: Repurchase rate measures percentage of subscribers who made additional one-time purchases beyond subscription box
Note: Average Order Value (AOV) of $22 reflects standard monthly subscription box price across all segments
Note: Revenue contribution: Millennial subscribers generated 48% of total 2024 revenue
Note: Internal stakeholder segment recommendations: Product Team recommends Gen Z subscribers, Finance Team recommends Millennial subscribers, Creative Team recommends Gen X subscribers
Note: All monetary values in USD; percentages shown as decimals in data columns
Open resourcePrioritizing Brightwell's Launch Segment
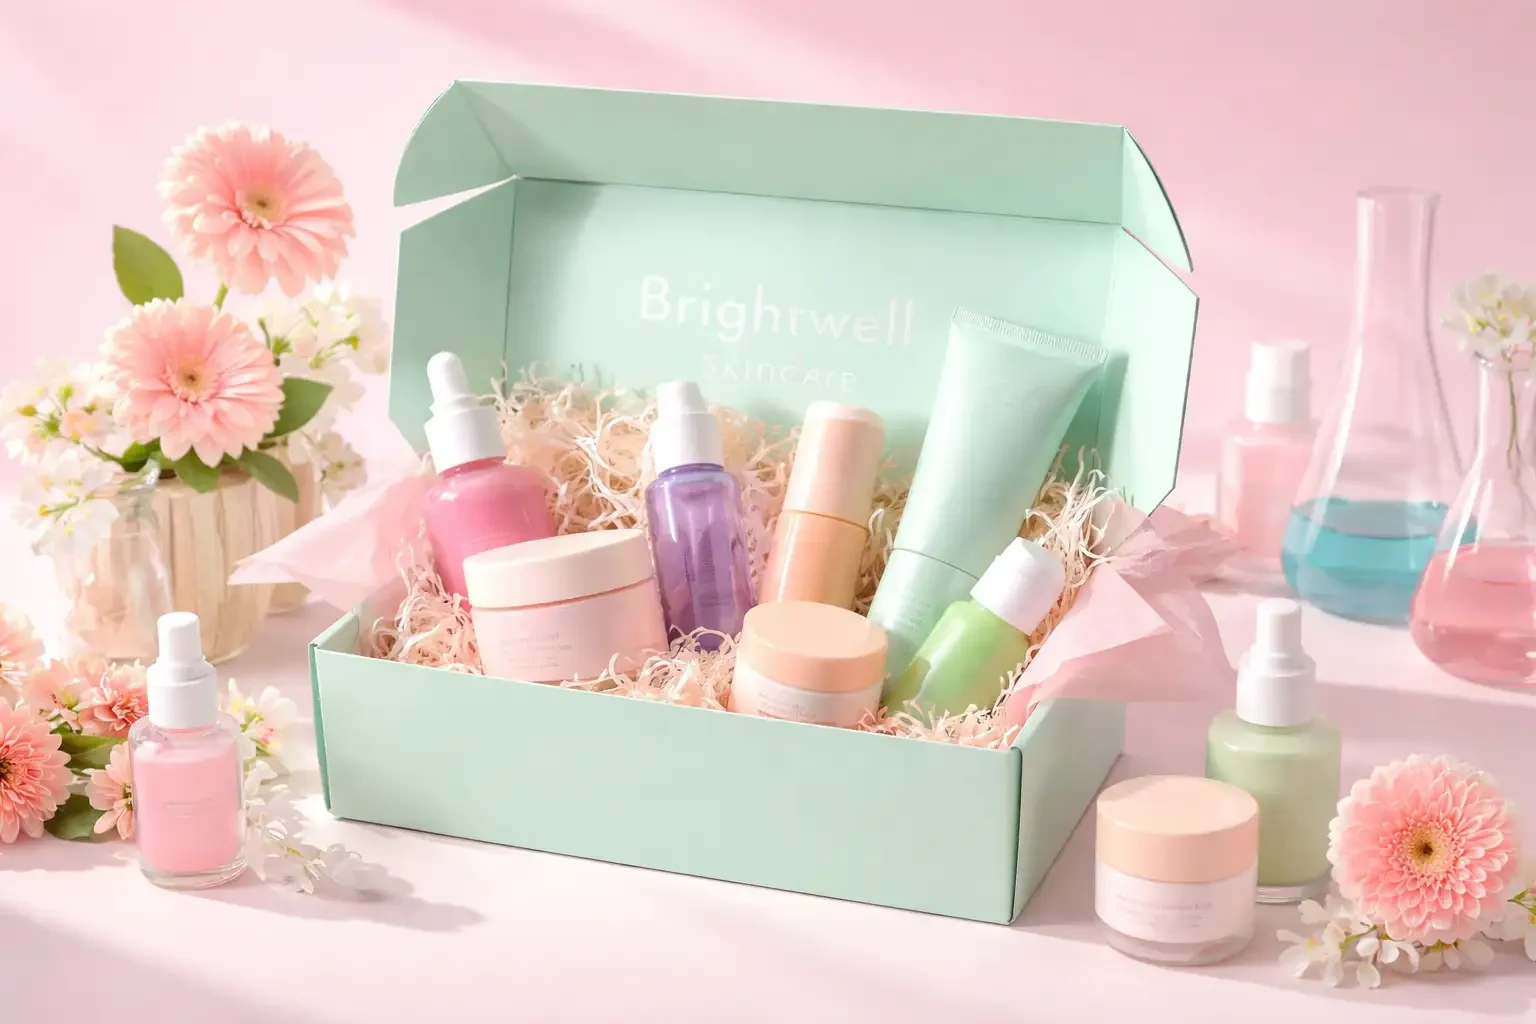
Brightwell Skincare
Brightwell Skincare
Role: Marketing AnalystA product development team at Brightwell Skincare is grappling with conflicting segment priorities for its next subscription box launch. As a Marketing Analyst, learners must analyze customer data across three distinct segments and recommend which segment should lead the launch to maximize subscriber growth and retention.
Learner journey
Project Brief
Review Brightwell's product launch challenge and segment prioritization decision.
Manager Video Call
Watch Priya Mehta explain the segment decision urgency and expectations.
Task Email
Receive assignment to analyze segments and recommend launch priority.
Review Resources
Examine customer data showing Gen Z, Millennial, and Gen X characteristics.
Written Task
Draft memo recommending which segment should lead the product launch.
Feedback
Receive evaluation on your segmentation analysis and recommendation quality.
Chat Defense
Justify your segment choice to Priya using data and segmentation principles.
Key moments
Key Moments highlight the workplace artifacts that make your topic feel real — like calls, emails, resources, and files.
Simulation details
- Intent
- Practical Application
- Level
- Undergraduate
- Format
- MicroSim
- Steps
- 3 tasks
- Est. Duration
- 45 min
Sample Feedback & Report
How assessment works
Identify where the student demonstrates proficiency in customer segmentation analysis and where performance gaps emerg...
Concept Accuracy
Correctly applies customer segmentation principles—demographic, psychographic, behavioral, and value-based criteria—to Brightwell Skincare's subscription beauty market context.
Framework Usage
Follows the segmentation-targeting-positioning sequence: identifies segments, evaluates attractiveness using size/growth/profitability metrics, selects target, and justifies positioning logic.
Contextual Application
Adapts segmentation theory to Brightwell Skincare's direct-to-consumer subscription model, viral brand positioning, and U.S. beauty box market dynamics rather than applying textbook frameworks mechanically.
Error Recognition
Identifies flawed assumptions about segment profitability, growth sustainability, or competitive positioning before finalizing the Brightwell Skincare product launch recommendation.
Reasoning Clarity
Structures the Brightwell segment recommendation with transparent logic: states selection criteria, presents data evidence, explains trade-offs, and connects conclusions to segmentation principles.
Critical Thinking
Demonstrates thorough analysis of Brightwell's customer data with specific segment comparisons and justified prioritization rather than surface-level assertions about growth or size.
Adaptability
Adjusts segment recommendation when new Brightwell data reveals changed profitability, churn rates, or competitive threats rather than rigidly defending initial segment choice.
Empathy
Considers how the product launch decision affects Brightwell's existing subscribers, potential new customers, and internal teams rather than optimizing for revenue metrics alone.
Intellectual Ownership
Defends the Brightwell segment recommendation substantively during executive challenge—explains data interpretation, segmentation logic, and trade-off reasoning rather than deflecting or retreating.
Metacognition
Flags data limitations in Brightwell's customer pack, qualifies assumptions about segment behavior, and adjusts reasoning when gaps in market knowledge are identified.